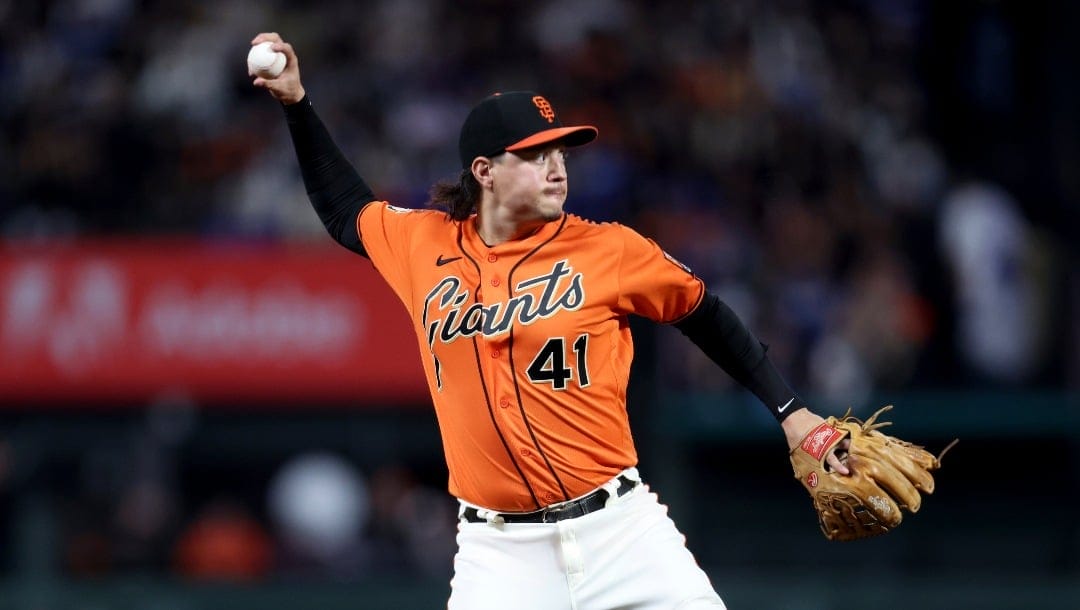
- The Giants are -150 favorites vs the Reds
- Reds vs Giants Over / Under today: 7.5 Runs
- Reds / Giants TV Channel: FDOH | NSBA | MLBN
The Cincinnati Reds (+125) visit Oracle Park to take on the San Francisco Giants (-150) on Wednesday, April 9, 2025. First pitch is scheduled for 3:45pm EDT in San Francisco, CA.
This season, the Reds are 4-7 against the spread (ATS), while the Giants are 7-3 ATS.
Reds vs Giants Starting Pitchers Today:
- Reds starting pitcher: Nick Martinez 0-2, 5.91 ERA
- Giants starting pitcher: Justin Verlander 0-0, 6.14 ERA
Reds vs. Giants Odds, Run Line, Over/Under & Moneyline
| Spread | Over / Under | Moneyline | |
| Reds | +1.5 -180 | O 7.5 -110 | +125 |
| Giants | -1.5 +145 | U 7.5 -110 | -150 |
Reds vs Giants Prediction for Today’s Game
Based on recent trends the model predicts the Giants will win Wednesday‘s MLB game with 56.9% confidence, factoring in game simulations, recent player performances, starting pitchers and injuries.
Bet now on Reds vs Giants and all games with BetMGM
We’ve highlighted some favorite MLB player prop bets for Reds players for Wednesday‘s game, looking at profitable historical betting trends:
Best Reds Player Prop Bets Today:
- Nick Martinez has hit the Earned Runs Under in 4 of his last 5 away games (+3.00 Units / 50% ROI)
- Nick Martinez has hit the Hits Allowed Under in 3 of his last 4 away games (+1.85 Units / 30% ROI)
- Nick Martinez has hit the Strikeouts Under in 4 of his last 6 away games (+1.25 Units / 17% ROI)
And here are some favorite MLB player prop bets for Giants players for Wednesday‘s game, looking at profitable historical betting trends:
Best Giants Player Prop Best Bets Today:
- LaMonte Wade Jr has hit the Singles Under in his last 8 games (+8.00 Units / 60% ROI)
- LaMonte Wade Jr has hit the Hits Under in 7 of his last 8 games (+7.65 Units / 95% ROI)
- LaMonte Wade Jr has hit the Total Bases Under in 7 of his last 8 games (+7.20 Units / 81% ROI)
- LaMonte Wade Jr has hit the Hits Runs and RBIs Under in 7 of his last 8 games (+6.35 Units / 61% ROI)
- LaMonte Wade Jr has hit the Runs Under in 7 of his last 8 games (+5.85 Units / 48% ROI)
Reds Best Bets Today:
- The Cincinnati Reds have hit the Team Total Under in 86 of their last 147 games (+17.00 Units / 10% ROI)
- The Cincinnati Reds have covered the Run Line in 82 of their last 144 games (+11.95 Units / 6% ROI)
- The Cincinnati Reds have hit the Game Total Under in 77 of their last 146 games (+9.90 Units / 6% ROI)
- The Cincinnati Reds have hit the 1st Five Innings (F5) Team Total Under in 11 of their last 14 away games (+8.30 Units / 55% ROI)
- The Cincinnati Reds have hit the Moneyline in 28 of their last 56 away games (+5.45 Units / 9% ROI)
Giants Best Bets Today:
- The San Francisco Giants have hit the Team Total Under in 20 of their last 27 games at home (+12.35 Units / 40% ROI)
- The San Francisco Giants have hit the Game Total Over in 65 of their last 121 games (+8.95 Units / 7% ROI)
- The San Francisco Giants have hit the 1st Five Innings (F5) Moneyline in 36 of their last 75 games (+8.02 Units / 8% ROI)
- The San Francisco Giants have hit the 1st Five Innings (F5) Team Total Over in 72 of their last 130 games (+6.08 Units / 4% ROI)
- The San Francisco Giants have hit the Moneyline in 8 of their last 12 games (+5.70 Units / 43% ROI)
Reds Against the Spread (ATS) Record
Against the spread this season, the Reds are 6-5 against the Run Line (-1 Units / -5.71% ROI).
- 4-7 when betting on the Moneyline for -3 Units / -25.75% ROI
- 5-6 when betting on the total runs Over for -1.6 Units / -13.17% ROI
- 6-5 when betting on the total runs Under for +0.55 Units / 4.56% ROI
Giants Against the Spread (ATS) Record
Against the spread this season, the Giants are 7-3 against the Run Line (+5.9 Units / 47.2% ROI).
- 8-2 when betting on the Moneyline for +5.8 Units / 47.35% ROI
- 6-4 when betting on the total runs Over for +1.5 Units / 13.76% ROI
- 4-6 when betting on the total runs Under for -2.8 Units / -25.23% ROI
Giants vs Reds Home Run Prop Bets Today
| Over | Under | |
|---|---|---|
| Matt Chapman (SF) | 0.5 +375 | 0.5 -525 |
| Willy Adames (SF) | 0.5 +400 | 0.5 -550 |
| Christian Encarnacion-Strand (CIN) | 0.5 +600 | 0.5 -900 |
| Elly De La Cruz (CIN) | 0.5 +625 | 0.5 -1000 |
| Heliot Ramos (SF) | 0.5 +650 | 0.5 -1000 |
Giants vs Reds Total Hits Prop Bets Today
| Over | Under | |
|---|---|---|
| Willy Adames (SF) | 0.5 -235 | 0.5 +175 |
| Jung-hoo Lee (SF) | 0.5 -220 | 0.5 +165 |
| Heliot Ramos (SF) | 0.5 -220 | 0.5 +165 |
| Christian Encarnacion-Strand (CIN) | 0.5 -220 | 0.5 +165 |
| Matt Chapman (SF) | 0.5 -210 | 0.5 +155 |
Giants vs Reds RBI Prop Bets Today
| Over | Under | |
|---|---|---|
| Matt Chapman (SF) | 0.5 +130 | 0.5 -175 |
| Willy Adames (SF) | 0.5 +170 | 0.5 -225 |
| Christian Encarnacion-Strand (CIN) | 0.5 +170 | 0.5 -225 |
| Heliot Ramos (SF) | 0.5 +185 | 0.5 -250 |
| Elly De La Cruz (CIN) | 0.5 +190 | 0.5 -250 |
Giants vs Reds Strikeout Prop Bets Today
| Over | Under | |
|---|---|---|
| Nick Martinez (CIN) | 3.5 -165 | 3.5 +125 |
| Justin Verlander (SF) | 4.5 -155 | 4.5 +120 |
Reds Starting Pitcher Stats & Trends
Nick Martinez has allowed an average Exit Velocity of just 86.5 MPH against his fastballs since the 2023 season (296 balls in play) — best in MLB among starting pitchers with at least 133 total IP; League Avg: 90.8
Nick Martinez has a strike rate of just 57% (57/100) against right-handed batters this season — 3rd lowest among qualified SPs in MLB; League Avg: 66% — fourth Percentile.
Opponents had a groundball rate of 74% (32/43) against Nick Martinez’s curve and slider in 2023 — highest among qualified RPs in MLB*; League Avg: 42% — 100th Percentile.
Nick Martinez has allowed an average Exit Velocity of just 85.7 MPH since the 2023 season (742 balls in play) — 2nd best in MLB among starting pitchers with at least 133 total IP; League Avg: 89.0
Giants Starting Pitcher Stats & Trends
Opponents had a groundball batting average of .398 (33 GB hits out of 83 GBs) against Justin Verlander in the 2024 season — highest in MLB among starting pitchers with at least 64 total IP; League Avg: .245 — 0 Percentile.
Opponents had a line drive rate of 35% (47/135) versus Justin Verlander on non-fastballs in the 2024 season — highest in MLB among starting pitchers with at least 64 total IP; League Avg: 23% — 0 Percentile.
Opponents are hitting just .241 (27-for-112) against Justin Verlander on the first pitch of at-bats since the 2023 season — 3rd best in MLB among starting pitchers with at least 133 total IP; League Avg: .342 — 98th Percentile.
Justin Verlander had a strikeout rate of just 15% (30/199) versus the bottom of the order in 2023 — lowest among qualified SPs in MLB; League Avg: 26% — second Percentile.
Reds Keys to the Game vs. the Giants
The Reds were just 5-16 (.238) when tied entering the 8th inning in the 2024 season — lowest in MLB; League Avg: .500.
The Reds were just 8-18 (.308) when tied entering the 7th inning in the 2024 season — tied for 2nd lowest in MLB; League Avg: .498.
The Reds are just 23-33 (.411) when tied entering the 7th inning since the 2023 season — 4th lowest in MLB; League Avg: .499.
The Reds are just 9-18 (.333) when tied entering the 7th inning since last season — tied for 3rd lowest in MLB; League Avg: .498.
Giants Keys to the Game vs. the Reds
The Giants are 6-73 (.076) when trailing entering the 9th inning since last season — 4th best in MLB; League Avg: .049.
The Giants are 11-146 (.070) when trailing entering the 9th inning since the 2023 season — 5th best in MLB; League Avg: .050.
The Giants are 5-1 (.833) on the road this season — best in MLB; League Avg: .385.
The Giants were just 20-24 (.455) vs bottom 10 scoring offenses in the 2024 season They play the Reds (16th best runs scored) today.
Reds Hitting Stats & Trends
Reds hitters are slugging just .145 on pitches out of the zone since last season — lowest in MLB; League Avg: .204.
The Reds are batting just .124 on pitches out of the zone since the 2023 season — lowest in MLB; League Avg: .150.
Reds hitters are slugging just .050 on pitches out of the zone this season — lowest in MLB; League Avg: .195.
The Reds are batting just .113 on pitches out of the zone since last season — lowest in MLB; League Avg: .149.
Giants Hitting Stats & Trends
Giants hitters slugged just .376 against LHP in the 2023 season — 3rd lowest in MLB; League Avg: .419.
Giants hitters had an OPS of just .683 (1,790 PA’s) against LHP in the 2023 season — 3rd lowest in MLB; League Avg: .742.
Giants hitters had an OBP of just .232 (3,303 PA’s) with two-strikes in 2023 — 2nd lowest in MLB; League Avg: .249.
Giants hitters have chased 21% of pitches out of the zone with runners in scoring position this season — lowest in MLB; League Avg: 30%.
Reds Pitching Stats & Trends
Opponents have a groundball rate of just 39% against Reds pitchers since last season — lowest in MLB; League Avg: 43%.
Reds pitchers have walked 28 of 413 batters (7%) this season — 2nd best in MLB; League Avg: 9%.
Opponents have a groundball rate of just 39% against Reds pitchers since the 2023 season — lowest in MLB; League Avg: 43%.
Opponents had a groundball rate of just 39% against Reds pitchers in 2023 — 2nd lowest in MLB; League Avg: 43%.
Giants Pitching Stats & Trends
Opponents had a groundball rate of 50% against Giants pitchers in 2023 — highest in MLB; League Avg: 43%.
Opponents have a groundball rate of 49% against Giants pitchers since the 2023 season — highest in MLB; League Avg: 43%.
Opponents had a groundball rate of 49% against Giants pitchers in the 2024 season — highest in MLB; League Avg: 43%.
Opponents have a groundball rate of 49% against Giants pitchers since last season — highest in MLB; League Avg: 43%.
More MLB Reading:
Bet now on Reds vs Giants and all games with BetMGM
Bet on MLB Odds at BetMGM
Sportsbook promos are always available at BetMGM. For new customers, check out the sportsbook welcome offer and BetMGM Refer a Friend. For existing customers, there are Odds Boosts, Parlay Boosts, contests and more.


