

Every NFL game is a battle, not just between teams but against the physical toll the sport takes on its players. From minor sprains to season-ending injuries, what happens on the field can drastically shift a team’s fortunes—and the bets tied to their success.
That’s why we wanted to analyze injury data from Pro Football Reference to see if we could gain any insight into the injuries the NFL has seen over the past five years.
In this study, we’ll highlight the fields that see the most and fewest injuries, explore trends by division and playing surface, and explain how these insights can help bettors make smarter, more responsible wagers.
The Most Injury-Prone NFL Fields
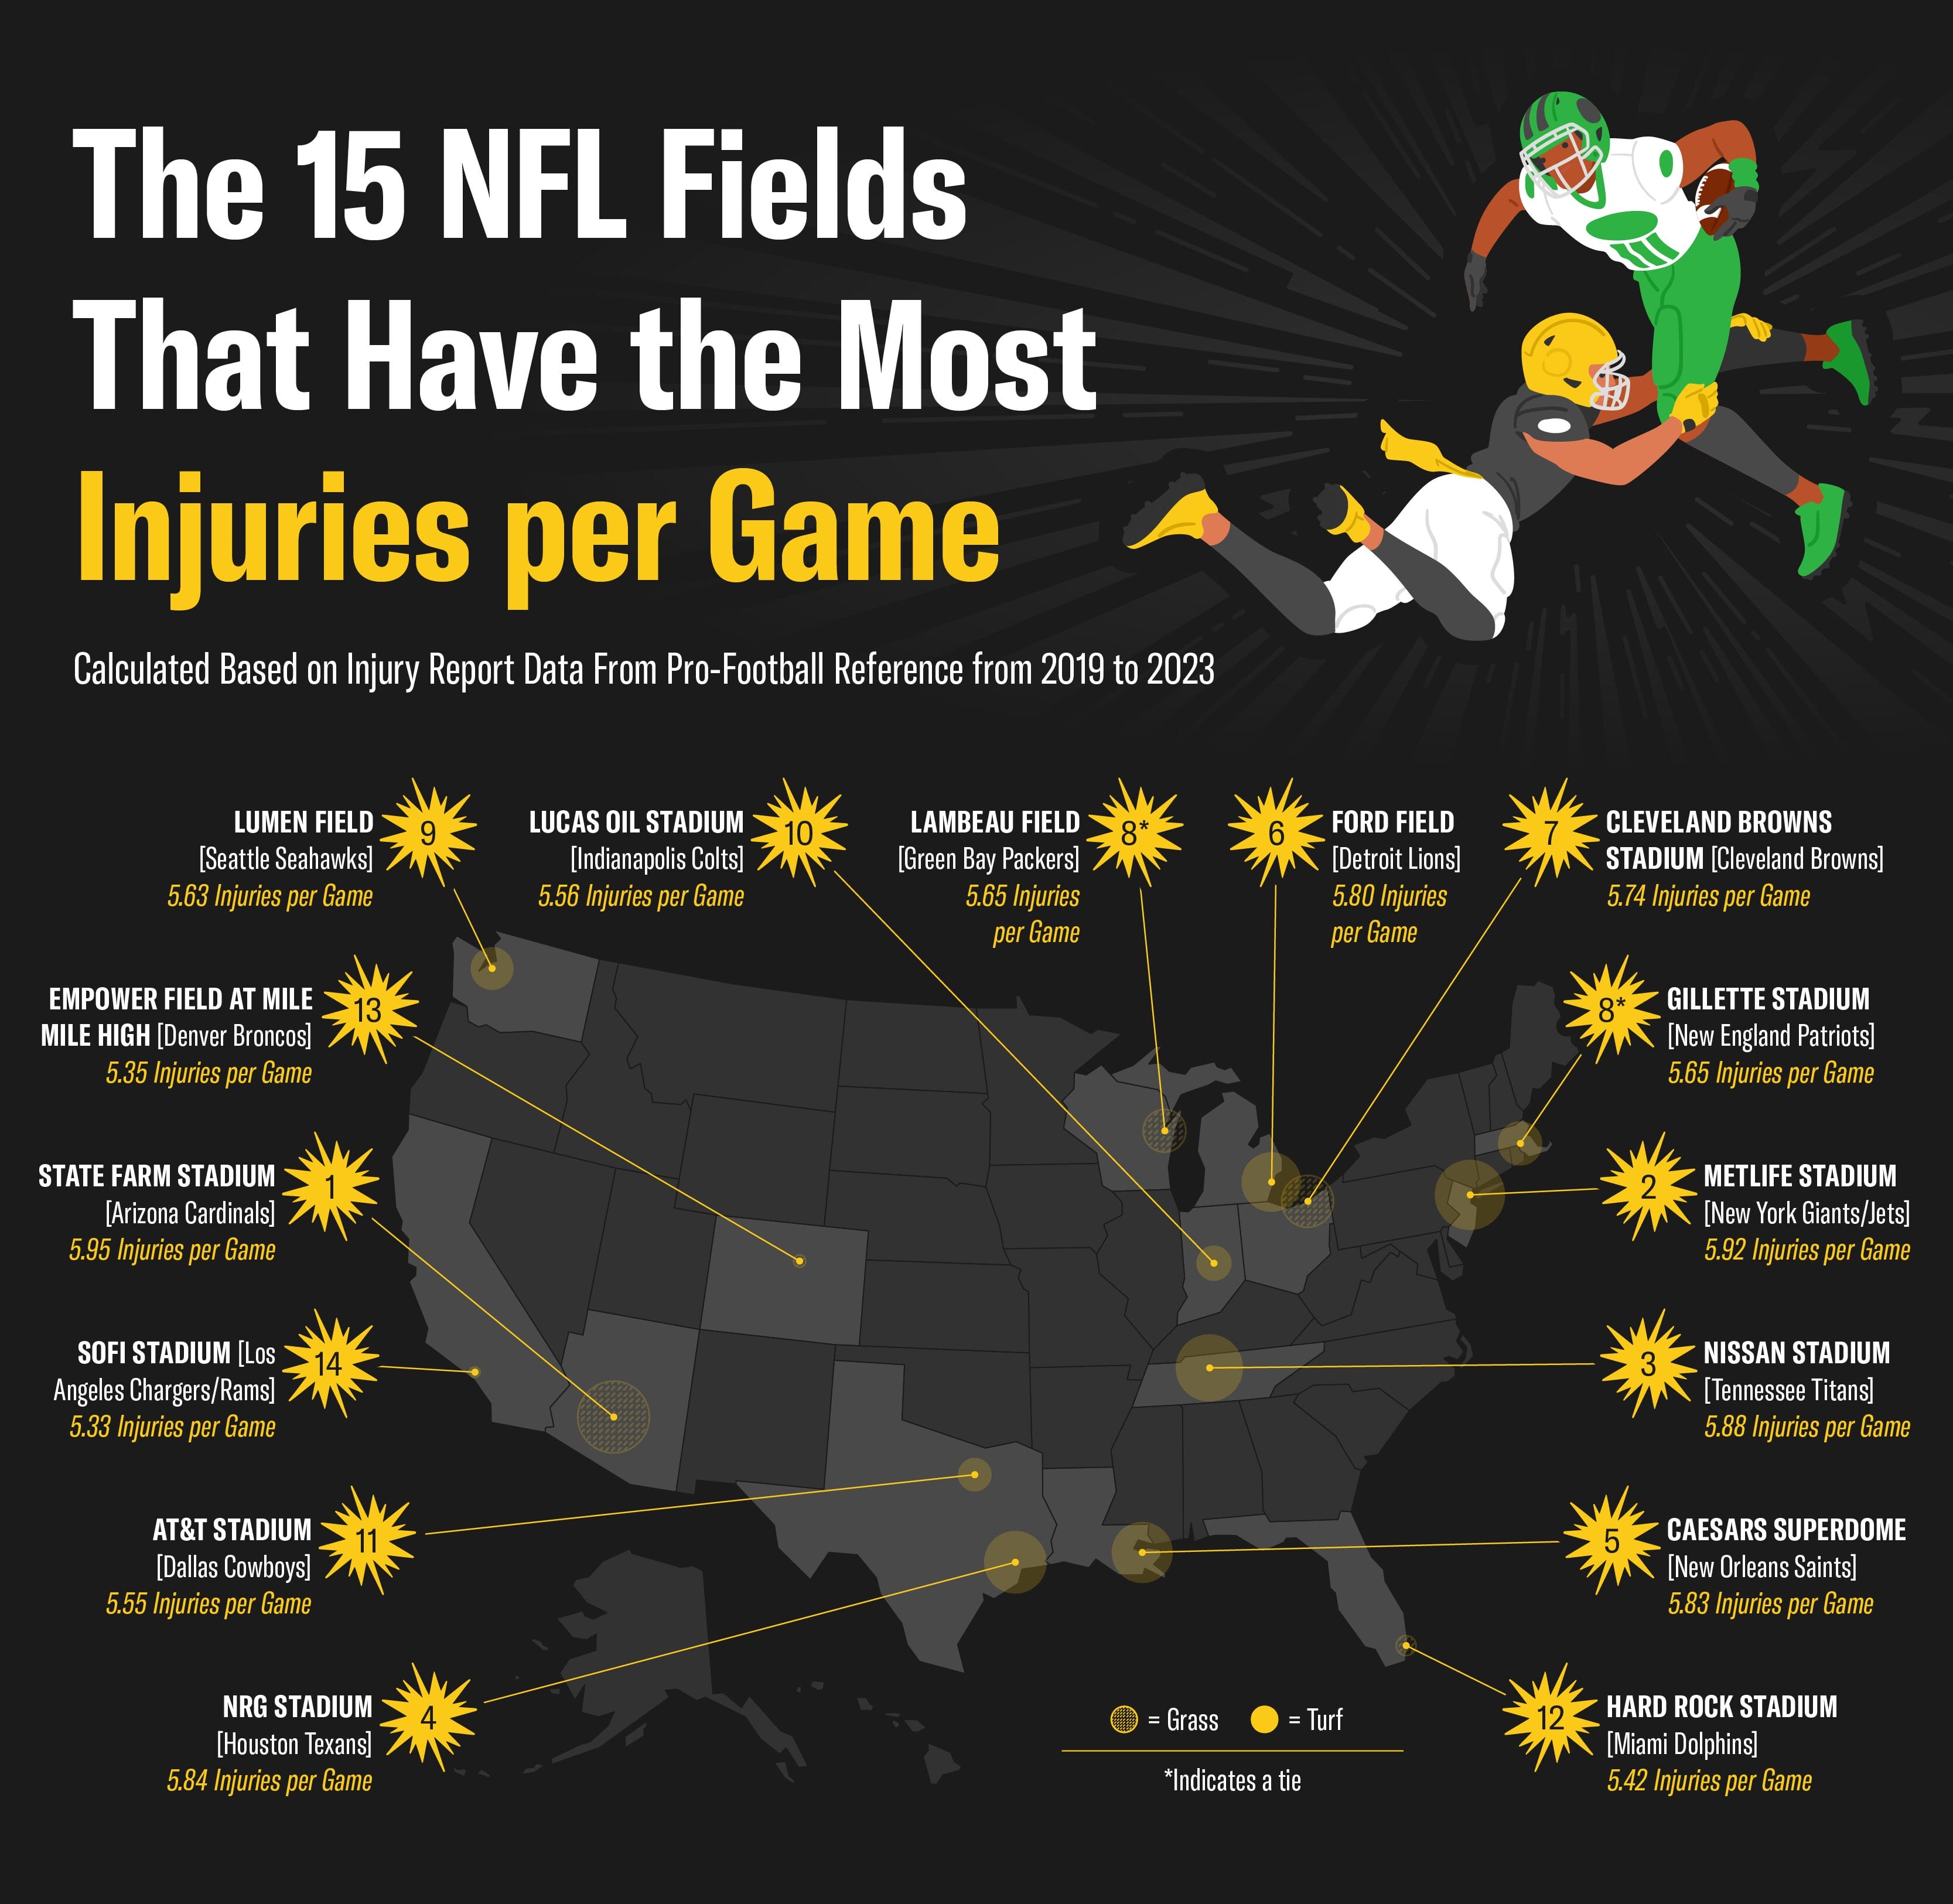
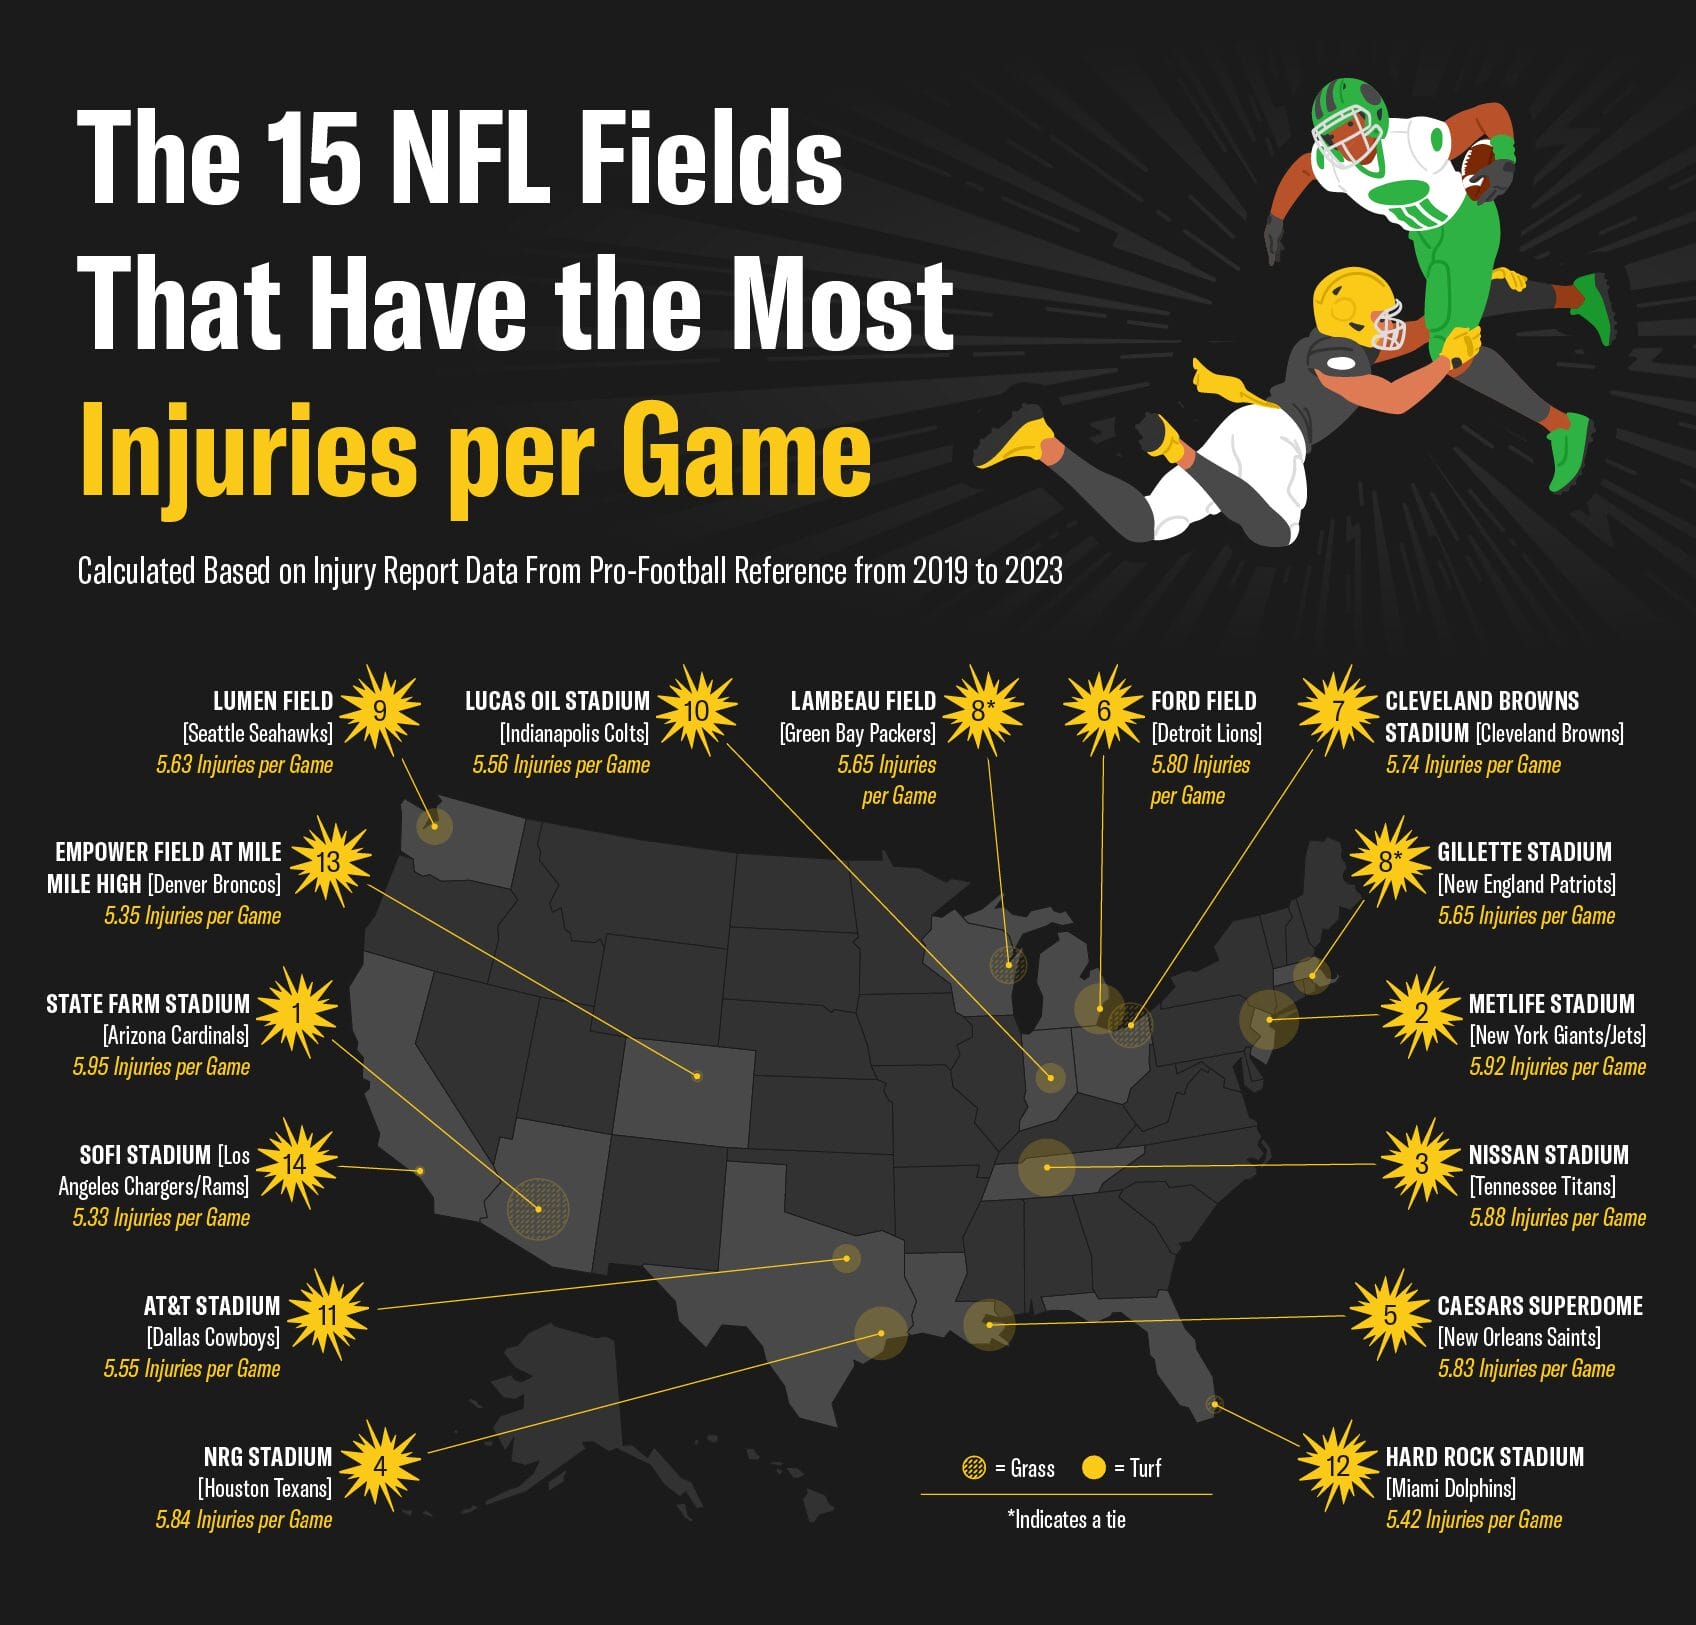
Injuries are an inevitable part of professional sports. In a particularly physical sport like the NFL, that’s doubly true, but some stadiums seem to see more action in the trainer’s room than others. We analyzed data from the past five seasons to determine which NFL home fields had the highest number of injuries per game, offering valuable insights for fans, bettors, and teams alike.
When it comes to the most injury-prone stadiums, State Farm Stadium in Arizona leads the list with an average of 5.95 injuries per game. Close behind is a stadium shared by New York’s NFL teams—MetLife Stadium averages 5.92 injuries per game, a consistent concern for both the Giants and Jets. Here’s a breakdown of the top five stadiums with the most injuries per game:
- State Farm Stadium (ARI) – 5.95 injuries per game
- MetLife Stadium (NYG/ NYJ) – 5.92
- Nissan Stadium (TEN) – 5.88
- NRG Stadium (HOU) – 5.84
- Caesars Superdome (NO) – 5.83
Interestingly, MetLife Stadium has been at the center of debates about its artificial turf, with several players and coaches pointing to the surface as a potential reason for the high injury count. We’ll take a closer look at the turf/grass breakdown later.
On the other end of the spectrum, Arrowhead Stadium in Kansas City sees the fewest injuries, averaging just 4.05 injuries per game. Here’s a look at the five stadiums where players are least likely to end up on the injury report:
- GEHA Field at Arrowhead Stadium (KC) – 4.05 injuries per game
- Raymond James Stadium (TB) – 4.38
- Highmark Stadium (BUF) – 4.42
- TIAA Bank Field (JAX) – 4.58
- Lincoln Financial Field (PHI) – 4.68
The low injury numbers at Arrowhead Stadium could be due to several factors, including field maintenance and the type of play that’s typical for the Chiefs’ offense, which relies heavily on quick passes and avoiding unnecessary hits.
Now that we’ve examined specific stadiums, let’s examine how injuries are broken down based on other variables.
More Injury Trends Across the NFL
While injuries can (and do) happen anywhere, we wanted to see if we could find any trends in injury frequency across divisions, playing surfaces, and seasons. Understanding these trends helps provide context to the data and sheds light on how various factors influence injury rates.
Injuries at Home Fields by Division
When it comes to divisional breakdowns, injury rates vary only slightly. AFC South teams lead the way with 5.47 injuries per home game, while the AFC West sees the fewest at 4.92.
Across the NFC, the NFC West holds the top spot with an average of 5.42 injuries per game.
Here’s the breakdown in every division:
- AFC Average – 5.25 injuries per game
- AFC South – 5.47
- AFC East – 5.46
- AFC North – 5.18
- AFC West – 4.92
- NFC Average – 5.34 injuries per game
- NFC West – 5.42
- NFC East – 5.40
- NFC North – 5.38
- NFC South – 5.17
Injuries at Home Fields by Playing Surface
Next, we’ll look at one of the most departed topics around the NFL that doesn’t involve GOAT discussions or wins and losses. We’re talking about playing surfaces.
Our analysis shows that turf fields see a slightly higher rate of injuries, with an average of 5.52 injuries per game compared to 5.04 on grass fields.
Players and coaches alike have raised concerns about the impact of artificial surfaces on player safety for years, so much so that Sportico has a series on the topic, Turf Wars.
Injuries at Home Fields by Year
Injury trends also fluctuate by year. The 2020 season saw a sizable uptick in injuries from 2019, jumping from 4.66 per game to 5.51. This could have been influenced by the shortened offseason during the COVID-19 pandemic (COVID injury designations were removed from our study).
The years following, including 2021 and 2022, also saw relatively high injury numbers.
- 2019 – 4.66 injuries per game
- 2020 – 5.51
- 2021 – 5.64
- 2022 – 5.31
- 2023 – 5.26
The spike in injuries in 2021 could be tied to players returning from a disrupted 2020 season as they worked to adjust to a more normal schedule. Although the 2023 season shows a slight decline in injuries, they still happened a fair bit more often than in 2019.
Understanding the patterns behind injuries, whether by location, division, or playing surface, gives us a chance to see how player safety is affected by various factors on and off the field.
Closing Thoughts
Injuries are part of the game, and in the NFL they can drastically change the course of a season. Whether it’s a high-profile quarterback sidelined or multiple players from the same team missing time, these injuries affect both the team and the outcomes of games.
For bettors, staying on top of injury trends is key to making smart decisions. Understanding which stadiums see more injuries and how different factors like playing surfaces impact players can give you an edge when placing bets.
At BetMGM, we provide the tools and insights to help you make informed wagers. Whether you’re tracking injury reports or keeping an eye on trends, BetMGM’s online sportsbook is here to help you stay ahead of the game on NFL Sundays.
Methodology
To identify the most injury-prone NFL fields, we analyzed injury report data from Pro-Football Reference for the 2019-2023 seasons. We attributed each injury to the field where the player competed the week before the injury was listed. If an injury extended over multiple weeks, it was only counted once. However, if a player was removed from the injury report and later re-listed, the second injury was attributed to the field from the week prior to their re-listing.
We adjusted for injuries occurring after bye weeks and excluded injuries from NFL International Series games. To ensure accurate comparisons across teams and years, we normalized the data to represent injuries per game rather than total injuries.
For the Los Angeles Chargers, the Los Angeles Rams, and Las Vegas Raiders, we excluded 2019 data from their current home fields as they changed stadiums in 2020. Additionally, we segmented the data by conference, division, year, and playing surface, noting that only Tennessee Titans changed its playing surface during this period, doing so in 2023.


